Melissa Coates of Coates Data Strategies has produced a new version of the Power BI End-to-End architecture document. If you haven’t seen this document it is definitely worth a read.
Summary of Changes
If you’d like to watch a quick webinar of the updates to the document you can watch it here.
Twitter Announcement
Here is the original announcement and release via twitter.
If you’d like to download the latest document you can find it here: https://www.coatesdatastrategies.com/diagrams
Note: The diagram can be downloaded as a PDF and as an Image.
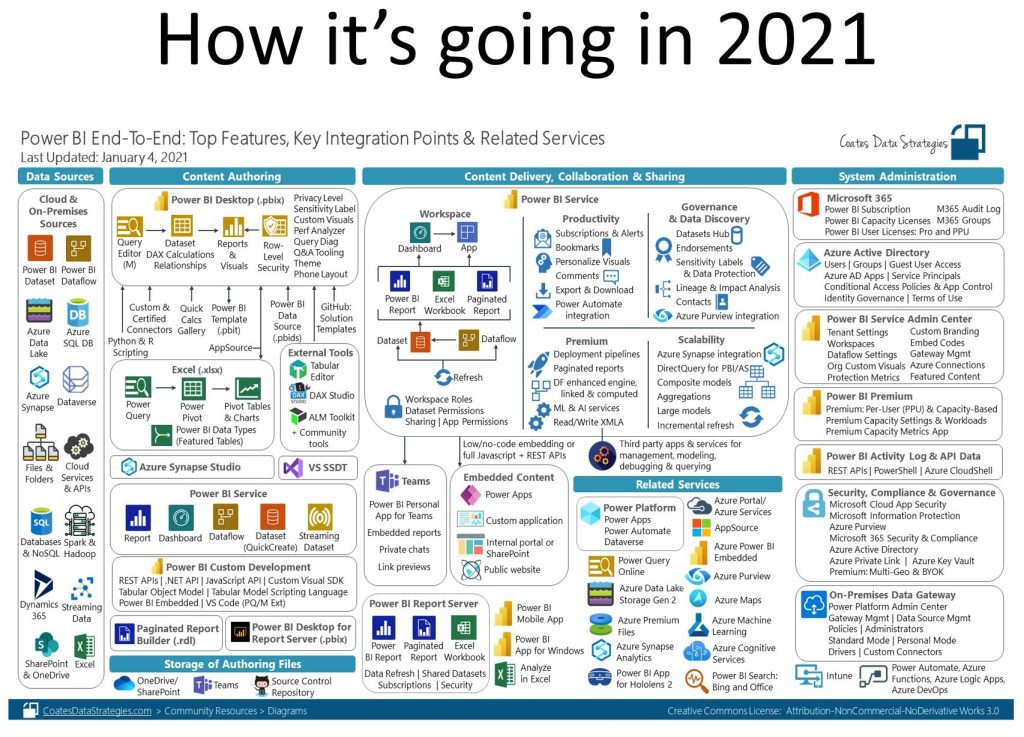
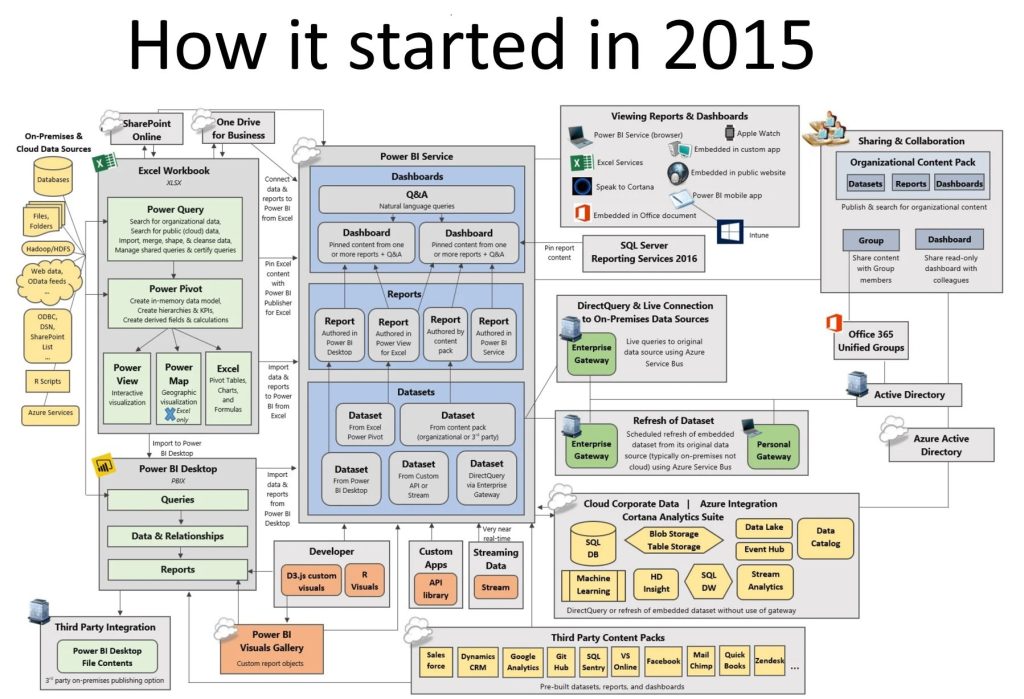
How it started / How it’s going
If you are on social media at all you will see meme’s about How it started vs. How it’s going. In the thread of Melissa’s tweet we have a fun image showing the progression of Power BI End-to-End architectures. The number of changes since 2015 is absolutely stunning. Power BI has grown up a lot since 2015. That being said, I’m greatly encouraged to see the Microsoft Power BI team pushing amazing new features.
Learn More about Power BI End-to-End
A one page document can contain a lot of information about Power BI. However, it can’t capture every aspect of Power BI. Thus, if you’d like to learn more about Power BI and it’s Administration, Please check out Melissa’s Training. The Power BI Development and Governance Workshop is a deep dive for users who need to administer Power BI.
We hope you enjoy this great document to use or share with your team. I’m confident that you will find areas of interest or learn about new ways to leverage Power BI.
Special thanks to Melissa Coates for participating in the quick webinar around the Power BI End-to-End architecture.
If you like the content from PowerBI.Tips please follow us on all the social outlets. Stay up to date on all the latest features and free tutorials. Subscribe to our YouTube Channel. Or follow us on the social channels, Twitter and LinkedIn where we will post all the announcements for new tutorials and content.
Introducing our PowerBI.tips SWAG store. Check out all the fun PowerBI.tips clothing and products:
I was having a candid conversation with Phil Seamark from DAX.tips about Aggregation Tables. During that conversation, I was asking about patterns in using Aggregation tables. Within that 10 minute conversation I was blow away by all the possible patterns. Because of this, we pleaded for Phil to present these patterns to the Milwaukee Brew City User Group.
While these patterns are described in detail here are the various patterns that can be used for Aggregation tables. Also, Phil includes a great introduction, found here. For each of these articles Phil describes proper usage for the pattern.
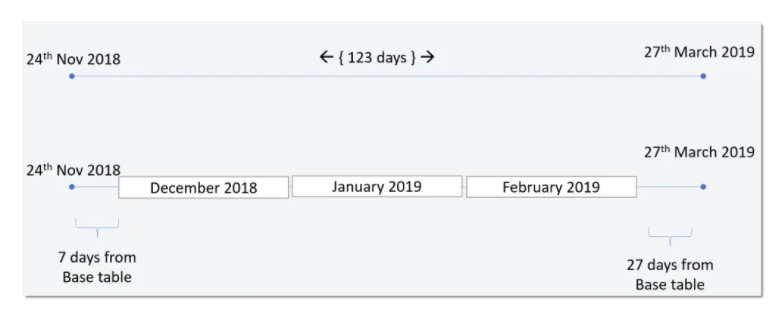
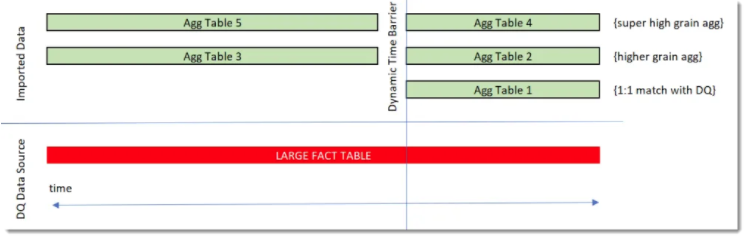
The Filtered Aggs would contain multiple Aggregation tables of the same data. But, each Agg table could contain different gains of data. For Example, data aggregated by Week, Month or Year.
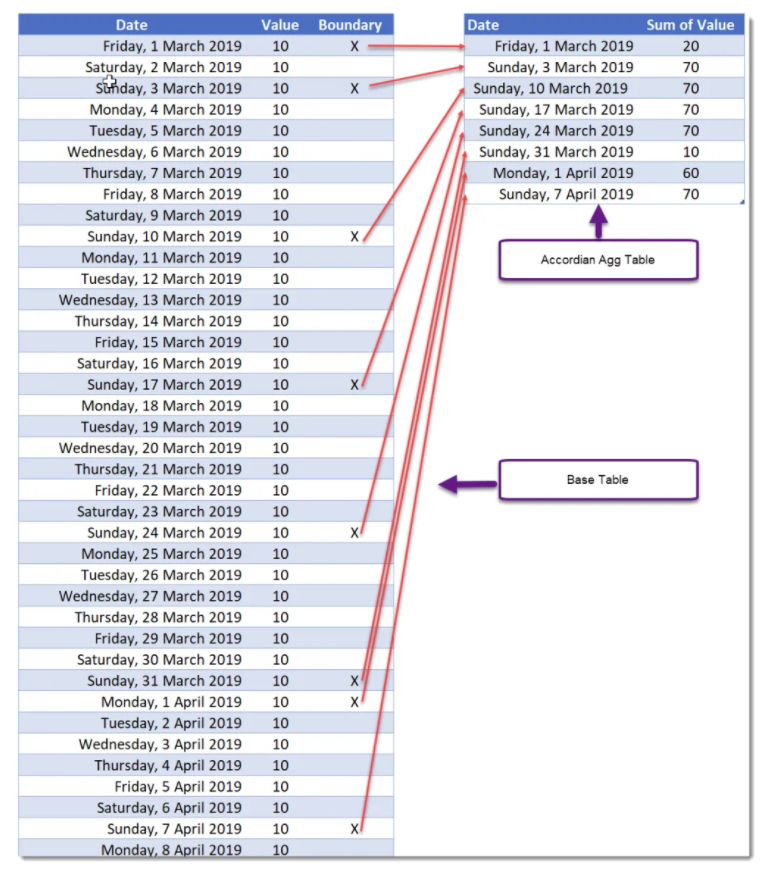
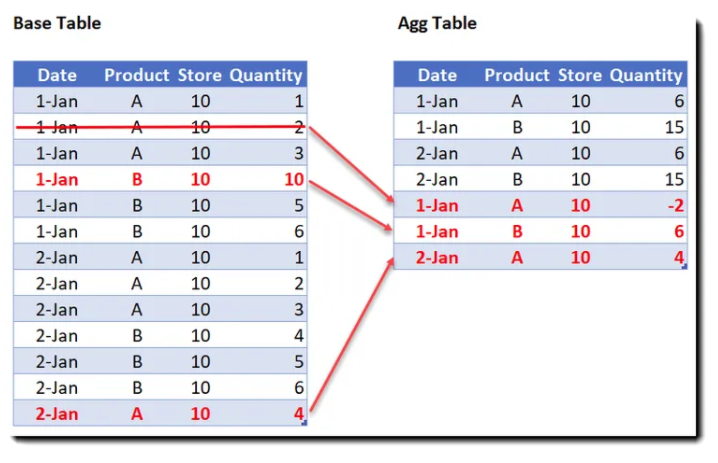
Finally, the Incremental Aggs. This type of aggregation would be used when aggregating transactions per day by store, and or product.
Thanks Phil
A special thanks to Phil for presenting. Since, we know you are a busy guy doing tons of great work. Thank you for taking time out of your day to present this wonderful topic. We hope you enjoy this exploration into Agg Tables.
If you like the content from PowerBI.Tips please follow us on all the social outlets. Stay up to date on all the latest features and free tutorials. Subscribe to our YouTube Channel. Or follow us on the social channels, Twitter and LinkedIn where we will post all the announcements for new tutorials and content.
Introducing our PowerBI.tips SWAG store. Check out all the fun PowerBI.tips clothing and products:
Well Microsoft has done it again. They have added a great feature in the Power BI desktop release for December 2020. Direct Query to Power BI data sources is a thing. As a result, this means we unlock new Architectural patterns.
Enterprise Modeling
In the Microsoft Release notes we get a glimpse of our new normal. Previously, Power BI datasets could only direct query certain data sources. Here is a full list of data sources for Power BI Desktop. The Enterprise Sematic model is simply larger view of a data model.
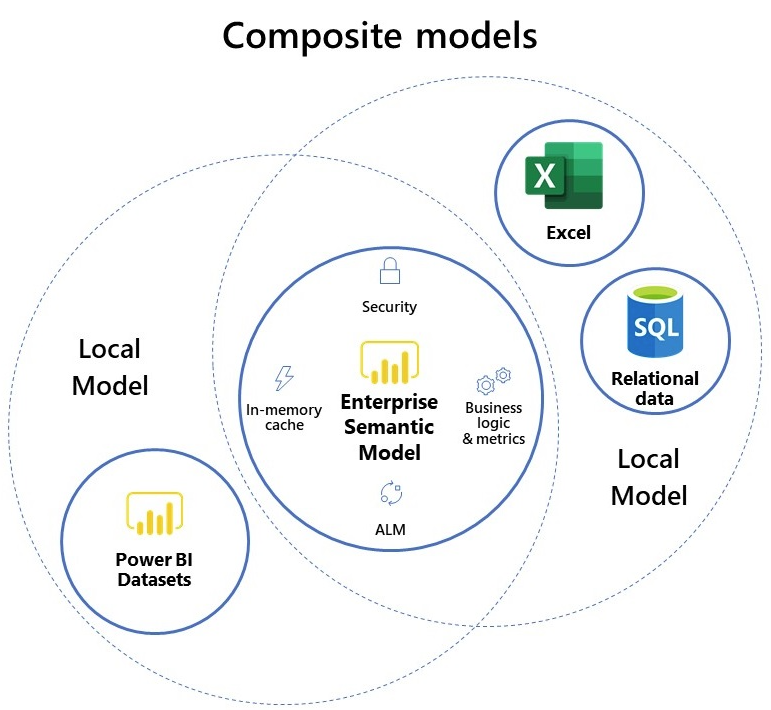
Quick background on Composite Models. A Composite model is a data model. More specifically, a Power BI data model. Typically Power BI models have multiple data sources. Such as, Excel, or SQL server. For certain data sources we load data in one of two ways, Importing, or Direct Query. The Import method loads data into the Power BI file. While, Direct Query leaves the data inside the data source, but sends queries to retrieve data on demand. Learn more about Import and Direct Query in these articles.
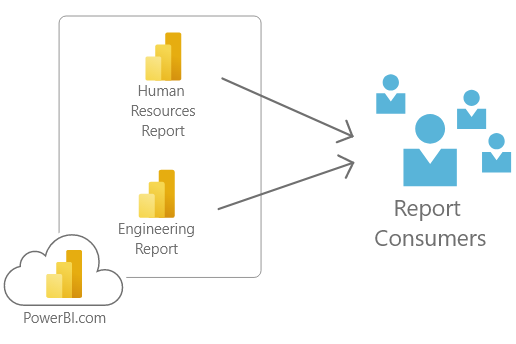
When we think of an organization there are likely hundreds of data models. These data models support by many different teams. Each model is solves some sort of problem. As an example, we can think about models developed for Human Resources. The Human Resource model informs the HR team about acquiring new talent, or track an interview process. Other teams such as Engineering track spend or project details.
Using this method, imagine a user who needs to see data from both human resources and engineering. Thus, a user would need to visit two different reports. Obviously value can given by combining multiple data models. This would enable the creation of a single report using data from both sources.
Direct Query for Power BI datasets
Now, lets consider the Enterprise Data model. In the Microsoft documentation this is called the Enterprise Semantic Model. We can think of the Enterprise Semantic Model as storing metadata linking tables of data and storing relationships between tables. Direct Query to PowerBI.com now lets us make models of models.
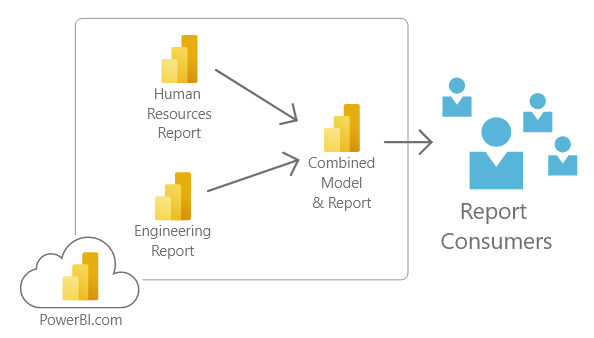
From our previous example now consider this architecture.
Report builders can now create a single model that queries other data models. This provides data from multiple subject matter areas. Thus, enabling a single report to combine data from multiple locations.
Centrally Managed Models
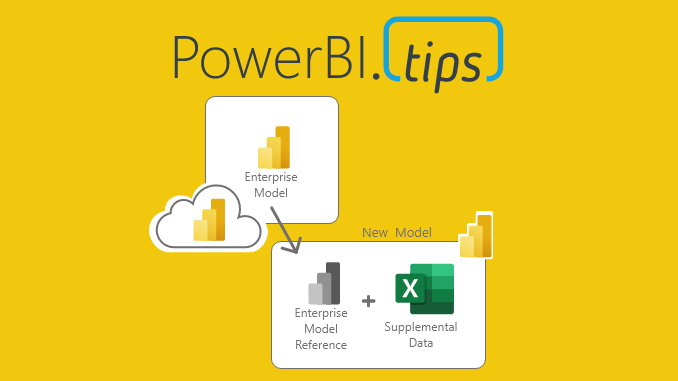
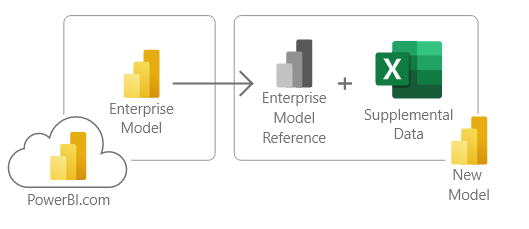
Often in larger organizations there will be different teams creating models. This means, you might not have access to modify an Enterprise build model. Again, Direct Query to models to the rescue. As a report author, I want to reuse an existing model. However, I would like to add more data to the model that would enrich my reporting. This may come in the form of a connected excel document. For this architecture consider the following diagram.
This new architecture is the ultimate success for self service business intelligence. Enterprise governed models can be enhanced by business users. Therefore, providing flexibility while controlling model governance and standards.
More Architecture thoughts
Power BI is evolving at a rapid pace. Because of this, Power BI is rapidly becoming one of the key tools. Therefore, more thought to Enterprise Architecture must be considered. Learn more about key architectural decision points in our previous articles, Data Architecture, and The Greater Data Solution.
Composite Models Conclusion
These are just some of my initial thoughts on this amazing new world we have. There will likely be many more designs and implementations from the community of Power BI developers. I’m extremely excited to see other patterns emerge from using Direct Query against Power BI datasets.
Read more from the official blog release and Microsoft documentation:
If you like the content from PowerBI.Tips please follow us on all the social outlets. Stay up to date on all the latest features and free tutorials. Subscribe to our YouTube Channel. Or follow us on the social channels, Twitter and LinkedIn where we will post all the announcements for new tutorials and content.
Introducing our PowerBI.tips SWAG store. Check out all the fun PowerBI.tips clothing and products:
Check out the new Merch!
Hasta La Vista Data
Go Ahead Make My Data
PBIX Hat
Power BI Swag Now Available
Now you can get your favorite Power BI gear. Visit our PowerBI.tips clothing store to purchase your favorite items.
We just completed an amazing webinar from Parker Stevens over at https://bielite.com/ . In this webinar, Parker walks us through how to connect to the Power BI Admin APIs. The Admin API contains a wealth of knowledge for all activity within your Power BI tenant.
While there is a good amount of reporting built into the Power BI admin page, you may need more. This is why you would use the Admin APIs to gather all the activity data from within your Power BI. For more information, learn about the Power BI Admin Portal.
Parker takes us through a deep dive connecting to the Power BI admin apis and shows us how to build a robust dataset ready for Admins to produce the reporting they need.
Watch the Full Webinar
If you like the content from PowerBI.Tips please follow us on all the social outlets. Stay up to date on all the latest features and free tutorials. Subscribe to our YouTube Channel. Or follow us on the social channels, Twitter and LinkedIn where we will post all the announcements for new tutorials and content.
Introducing our PowerBI.tips SWAG store. Check out all the fun PowerBI.tips clothing and products:
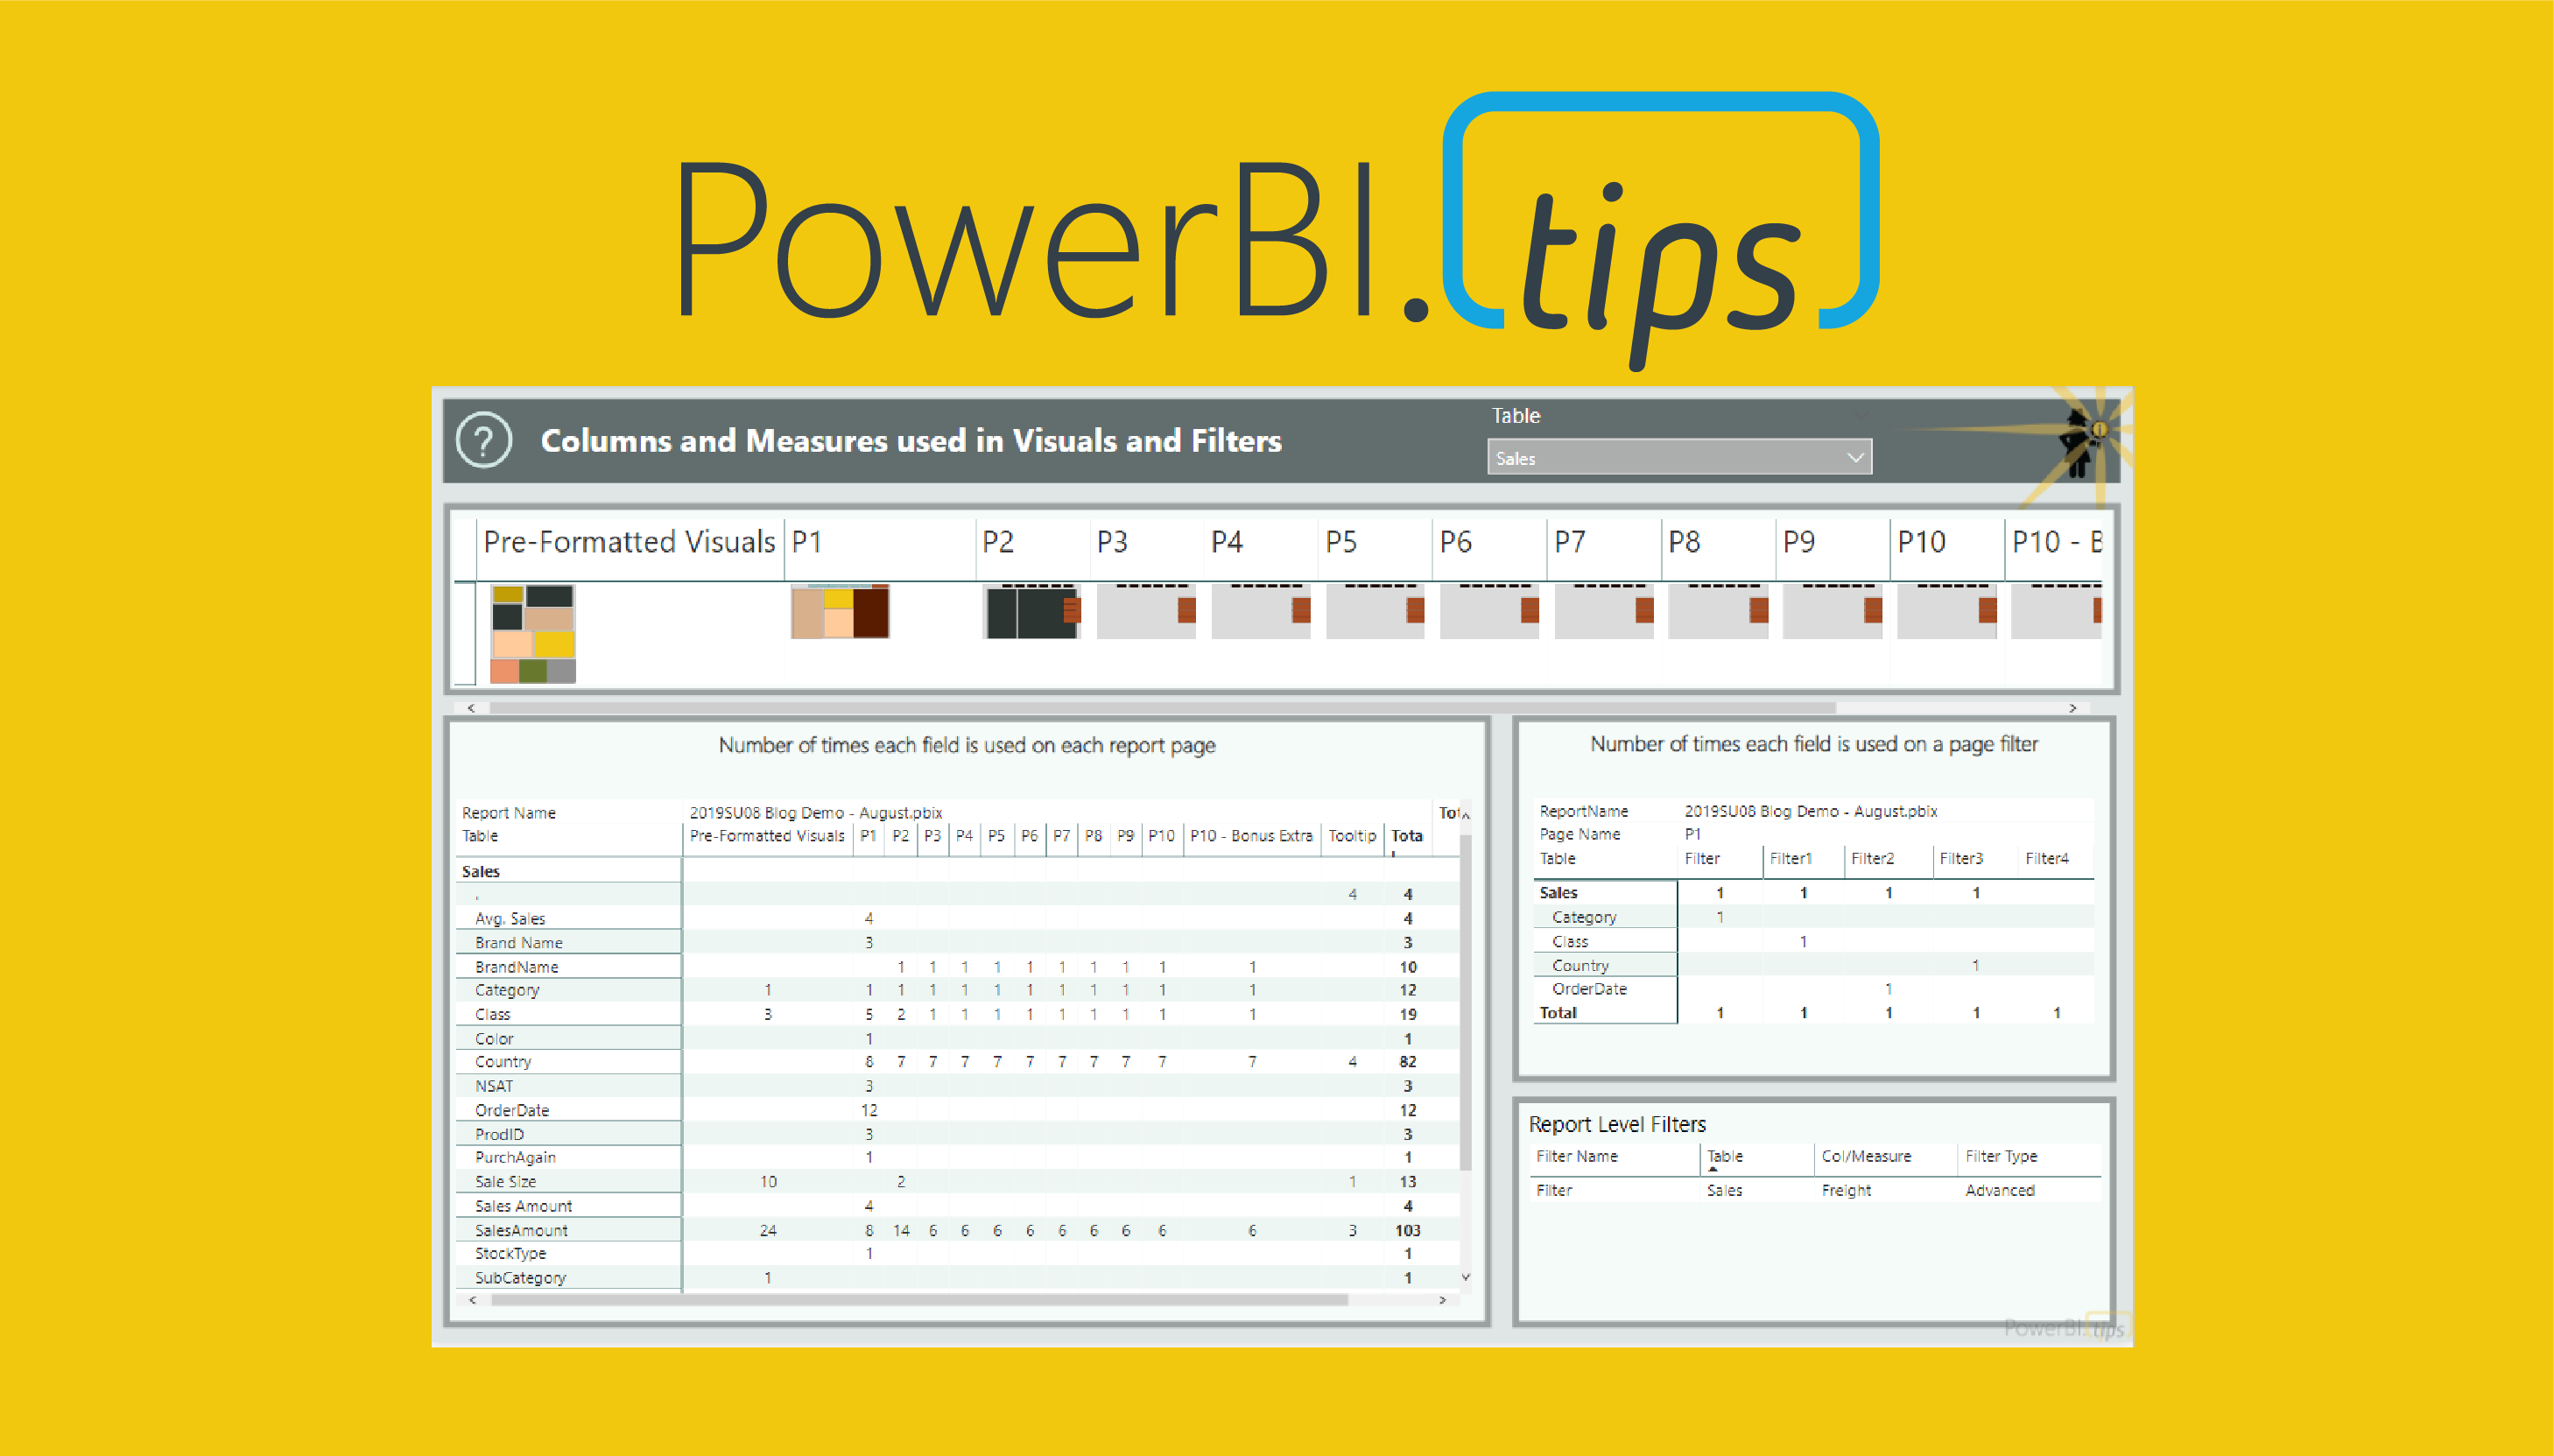
The Power BI Field Finder created by Stephanie Bruno was just updated. In this recent update the HTML viewer has been updated since the old custom visual has been deprecated.
What is Field Finder?
We are glad you asked. The Power BI Field finder is a tool that can be used to review all the relevant connections between tables, measures and visuals within a report. This solution is easy to use and very informative. Simply point the Field Finder at a PBIX file. Then the Field Finder tool will de-construct all the visual elements of the report and digest them in to one complete data set.
Why do I need it?
If you have done any Power BI development over the years, you will notice a pattern.
Start building a report
Create some measures for a visual
Measures don’t work or report needs changes
Make more measures
Delete and replace visuals
Add visual styles and elements requiring additional measures
Finally publish report
After completing this process, which could be over the span of days to months. You will likely have a Power BI report with extra measures or un-needed calculated columns.
Then you are introduced with a problem, How do I go through and clean up the entire report? Do I need to click on every single visual to see which measures are used?
Doing this for a page or two you quickly are overwhelmed with tracking all that information. This is where Power BI Field Finder really shines. It handles all of that for you with a couple button clicks.
Download Power BI Field Finder
Be sure to download field finder for yourself.
If you like the content from PowerBI.Tips please follow us on all the social outlets. Stay up to date on all the latest features and free tutorials. Subscribe to our YouTube Channel. Or follow us on the social channels, Twitter and LinkedIn where we will post all the announcements for new tutorials and content.
Introducing our PowerBI.tips SWAG store. Check out all the fun PowerBI.tips clothing and products:
I was recently contacted by Power BI Community member Gomathy Viswanathan and Ashwini Nayak. Thus, it is my pleasure share with you their incredible report. The Harry Potter Escape room. If you are as curious as I was you will enjoy this fun and light hearted puzzle.
Play the Game
Take a little break today and give the Harry Potter Escape room a try.
The Creators
Escape Room, Harry Potter Edition was originally posted on the Power BI Community. Be sure to follow Gomathy and Ashwini on LinkedIn. For a quick tutorial on how to use the game the creators watch the video below.
Download the Game
Feel free to download a copy of the Escape Room to see how it was built. While these games are fun to play, there are many techniques you can learn from. Learning the ins and outs of bookmarking definitely will help your report building skills for example.
If you like the content from PowerBI.Tips please follow us on all the social outlets. Stay up to date on all the latest features and free tutorials. Subscribe to our YouTube Channel. Or follow us on the social channels, Twitter and LinkedIn where we will post all the announcements for new tutorials and content.
Introducing our PowerBI.tips SWAG store. Check out all the fun PowerBI.tips clothing and products:
The Milwaukee Crew is back at it again with the October 2020 Power BI User Group (PUG). This month we have the amazing Gil Raviv talk to us about Power Query and the Enterprise. For those of you who don’t know Gil he is a superb Power Query Expert.
Gil talks to about Power Query in different enterprise domains. Learn which tools to use and which ones are not quite ready for prime time. You will learn a ton in this great session.
If you like the content from PowerBI.Tips please follow us on all the social outlets. Stay up to date on all the latest features and free tutorials. Subscribe to our YouTube Channel. Or follow us on the social channels, Twitter and LinkedIn where we will post all the announcements for new tutorials and content.
Introducing our PowerBI.tips SWAG store. Check out all the fun PowerBI.tips clothing and products:
Daniel Marsh-Patrick is a custom visual developer who recently released the HTML Content, a custom visual. This month we go over this visual in detail with it’s creator himself.
While this visual is currently at V1, Daniel shows us a preview of V2 and trust me you will absolutely love it. I’m so looking forward to using this visual in my daily workflow. As well as V2 is going to be amazing.
If you like Daniel’s work please consider sponsoring him. This way we can continue to get amazing visuals: https://github.com/sponsors/dm-p
If you like the content from PowerBI.Tips please follow us on all the social outlets. Stay up to date on all the latest features and free tutorials. Subscribe to our YouTube Channel. Or follow us on the social channels, Twitter and LinkedIn where we will post all the announcements for new tutorials and content.
Introducing our PowerBI.tips SWAG store. Check out all the fun PowerBI.tips clothing and products:
Horary! The Power BI desktop for October finally arrived and it is packed with tons of updates. I’m super excited about this month’s release. We rallied the troops and have a ton of MVPs talking about the latest release of Power BI desktop
If you like the content from PowerBI.Tips please follow us on all the social outlets. Stay up to date on all the latest features and free tutorials. Subscribe to our YouTube Channel. Or follow us on the social channels, Twitter and LinkedIn where we will post all the announcements for new tutorials and content.
Introducing our PowerBI.tips SWAG store. Check out all the fun PowerBI.tips clothing and products:
In the October 2020 release of Power BI desktop you have the ability to load a dataset from the splash page. For this tutorial we dig in on how Microsoft enables a default dataset. Additionally we show you how to customize the default dataset for your needs.
Quite often I need to prototype a visual, or work on some sample data to design a report. The very first step is always loading some sample data. Now that Power BI desktop comes with a default dataset, we leverage this feature to speed up our development process.
Watch the YouTube Video
Additional Thoughts
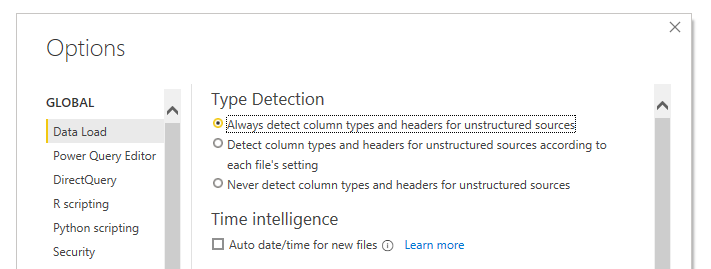
In this video I explain that the dataset does not auto load with datatypes enabled. This was due to my default setting within Power BI desktop. If you’d like you can make Power BI Desktop auto detect your datatypes for you.
This setting can be changed by the following steps:
Click on the File button
In the drop down menu, Click on the Options and Settings
In the menu on the right Click the button labeled Options
Under the Global section in the Options menu Select the item labeled Data Load
Change the Type Detection for loading data
If you like the content from PowerBI.Tips please follow us on all the social outlets. Stay up to date on all the latest features and free tutorials. Subscribe to our YouTube Channel. Or follow us on the social channels, Twitter and LinkedIn where we will post all the announcements for new tutorials and content.
Introducing our PowerBI.tips SWAG store. Check out all the fun PowerBI.tips clothing and products:
Check out the new Merch!
Hasta La Vista Data
Go Ahead Make My Data
PBIX Hat
Manage Consent
To provide the best experiences, we use technologies like cookies to store and/or access device information. Consenting to these technologies will allow us to process data such as browsing behavior or unique IDs on this site. Not consenting or withdrawing consent, may adversely affect certain features and functions.
Functional
Always active
The technical storage or access is strictly necessary for the legitimate purpose of enabling the use of a specific service explicitly requested by the subscriber or user, or for the sole purpose of carrying out the transmission of a communication over an electronic communications network.
Preferences
The technical storage or access is necessary for the legitimate purpose of storing preferences that are not requested by the subscriber or user.
Statistics
The technical storage or access that is used exclusively for statistical purposes.The technical storage or access that is used exclusively for anonymous statistical purposes. Without a subpoena, voluntary compliance on the part of your Internet Service Provider, or additional records from a third party, information stored or retrieved for this purpose alone cannot usually be used to identify you.
Marketing
The technical storage or access is required to create user profiles to send advertising, or to track the user on a website or across several websites for similar marketing purposes.