The ALM Toolkit is an excellent tool for aiding users with Tabular Model management. Christian Wade has been generous enough to provide us with a detailed tutorial on the ALM ToolKit.
In this webinar Christian Wade takes us on a guided tour of the key features and use cases for ALM ToolKit.
ALM Toolkit Feature Set
Database Compare
Code Merging
Making Deployment Easy
Source-control Integration
Reuse of common Definitions
YouTube Video of Webinar
If you like the content from PowerBI.Tips please follow us on all the social outlets. Stay up to date on all the latest features and free tutorials. Subscribe to our YouTube Channel. Or follow us on the social channels, Twitter and LinkedIn where we will post all the announcements for new tutorials and content.
Introducing our PowerBI.tips SWAG store. Check out all the fun PowerBI.tips clothing and products:
Maps are a fantastic way to communicate spatial data – and lucky for us Power BI has loads of awesome mapping visuals to choose from. However, the MapBox Custom Visual is definitely my favorite!
This Tutorial will walk you through the basics of getting started with MapBox.
Why
do I love MapBox?
It’s versatile: You can create pretty
much any type of map you’d like, whether it be Circle, Heatmaps, Clusters,
Chloropleths, Rasters…there’s plenty of options to chose from all in the one
visual.
Ability to customise: Using the MapBox Studio,
you can design and host your own spatial datasets, create custom base maps, and
visualise them in Power BI.
But best of all… It’s
free:
Unlike the ArcGIS custom visual, where to unlock most of the cool features you
need a paid ArcGIS online licence, you have access to all of MapBox’s amazing
features with their free account.
MapBox is Feature Rich
With
so many features available in MapBox, I know that I was pretty overwhelmed when
I was first getting started. So, in this video blog I walk through the key
steps to help you get started on your MapBox journey, including how to:
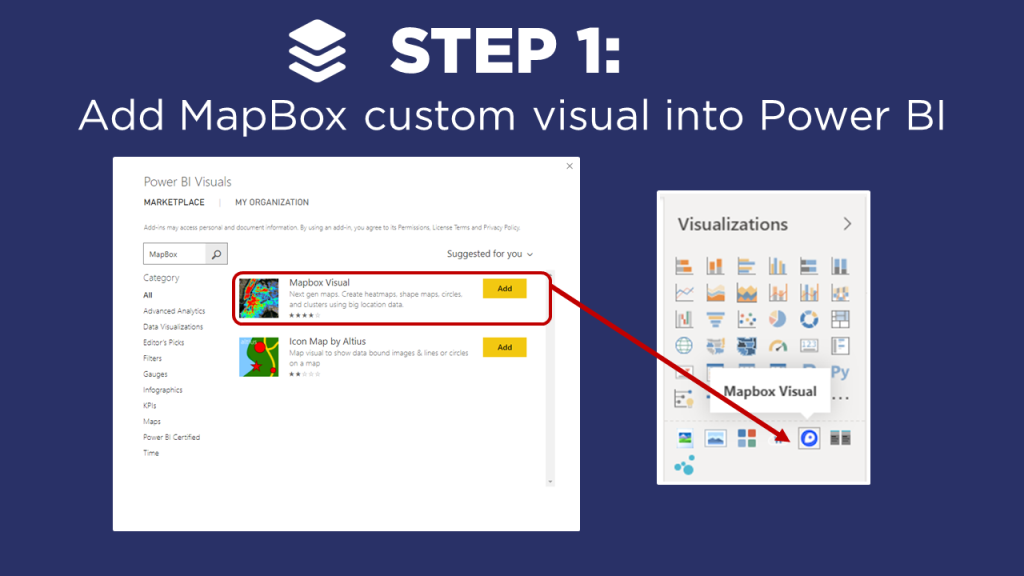
Add the MapBox custom
visual into Power BI
Create a MapBox account
and access token
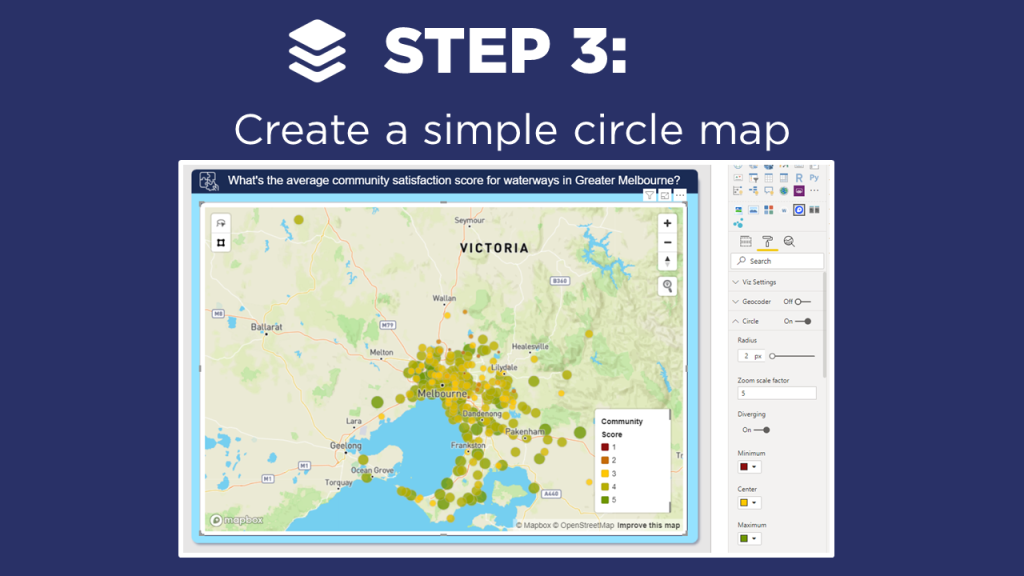
Create a simple circle map
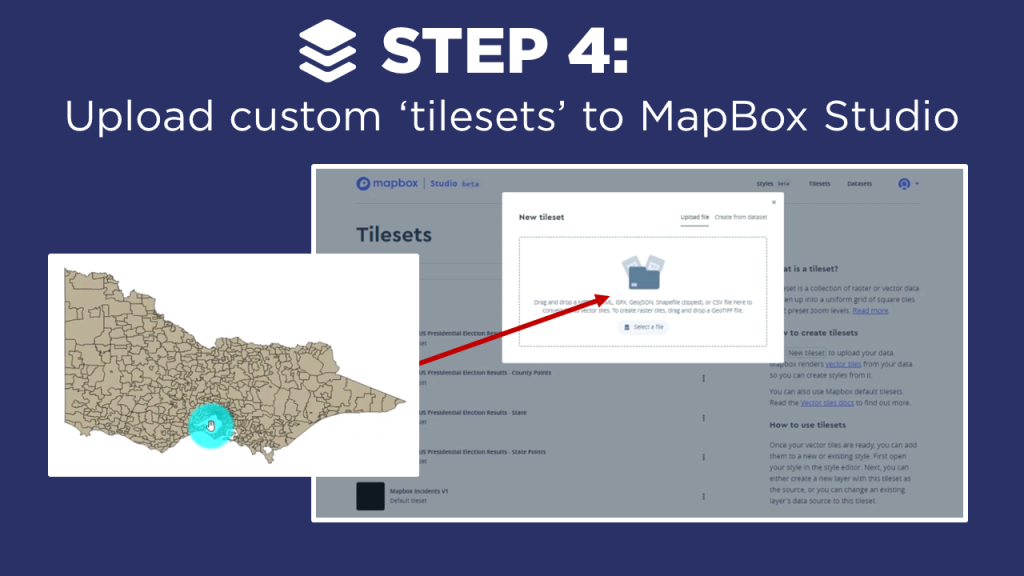
Upload custom ‘tilesets’
to the MapBox Studio
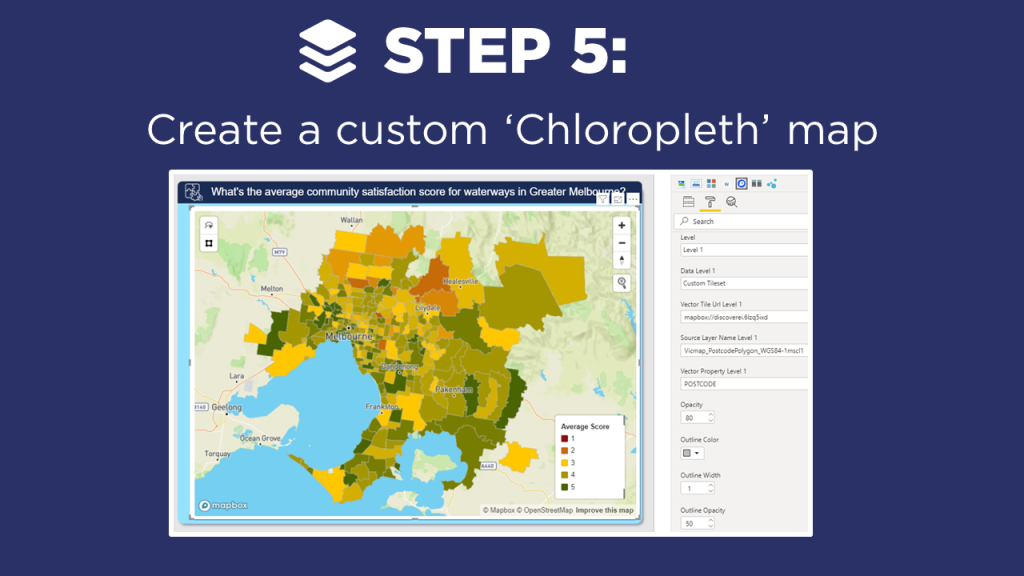
Create a custom
‘Chloropleth’ map (just a fancy name for an area map…)
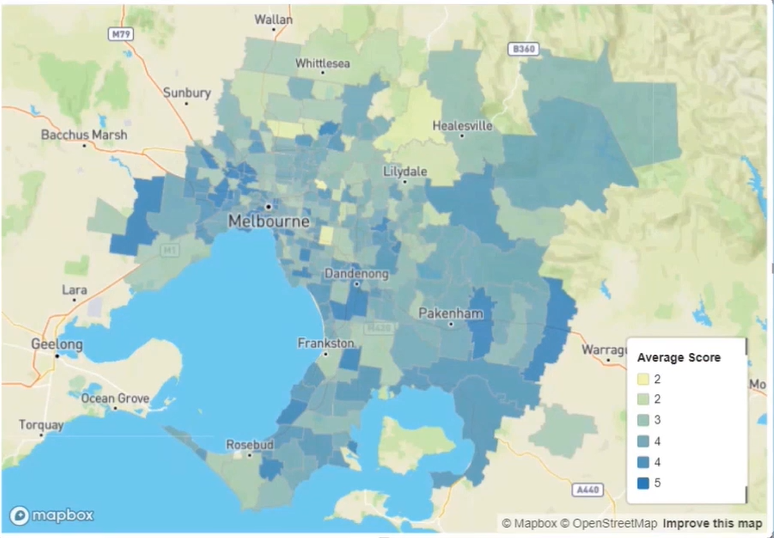
In my example, I create both a circle and chloropleth map using ‘synthetic data’ which I created to visualise community satisfaction scores for priority waterways across Melbourne (my hometown!).
Instructions
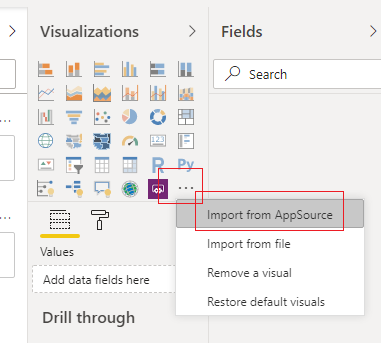
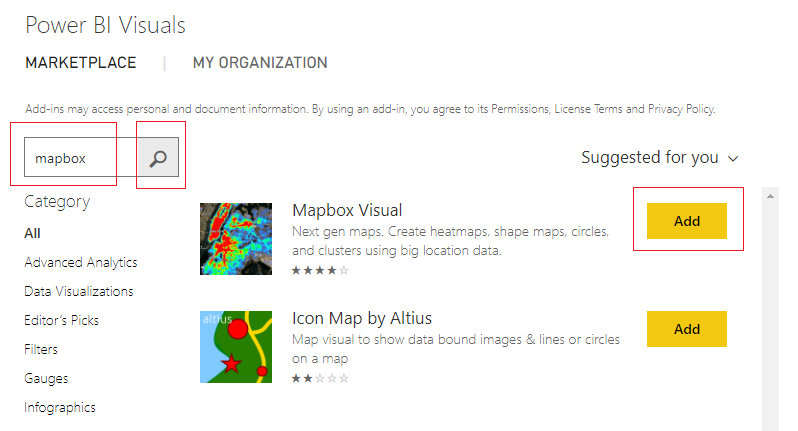
Click on the ellipsis in the Visualizations window and Select the option Import from AppSource in the drop down menu.
Enter in the search window the words mapbox. Click on the Search Glass icon. Then Click on the Add button next to the Mapbox Visual.
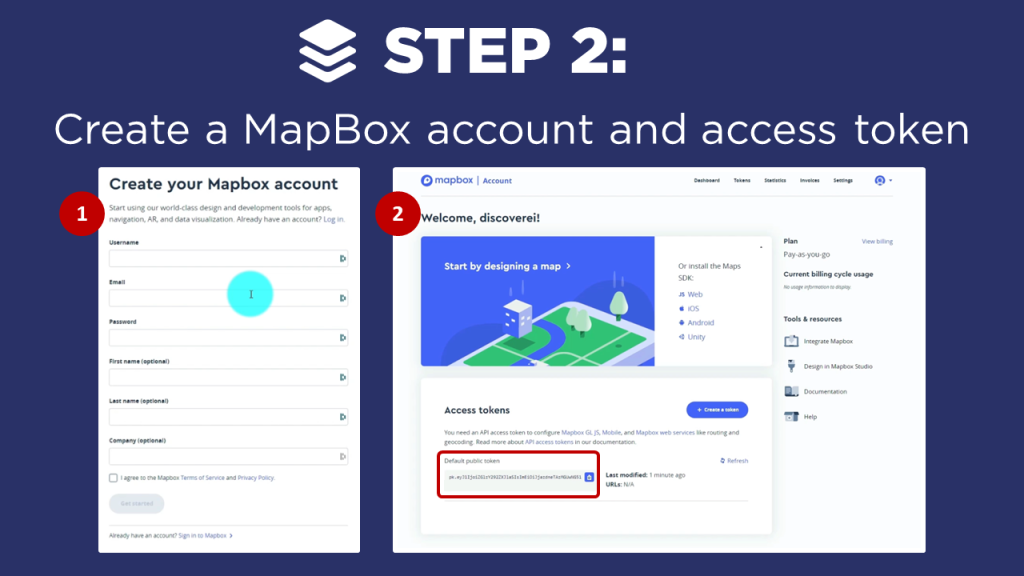
Visit the website mapbox.com and Sign In. If you don’t already have an account you will need to create one. An account can be created here.
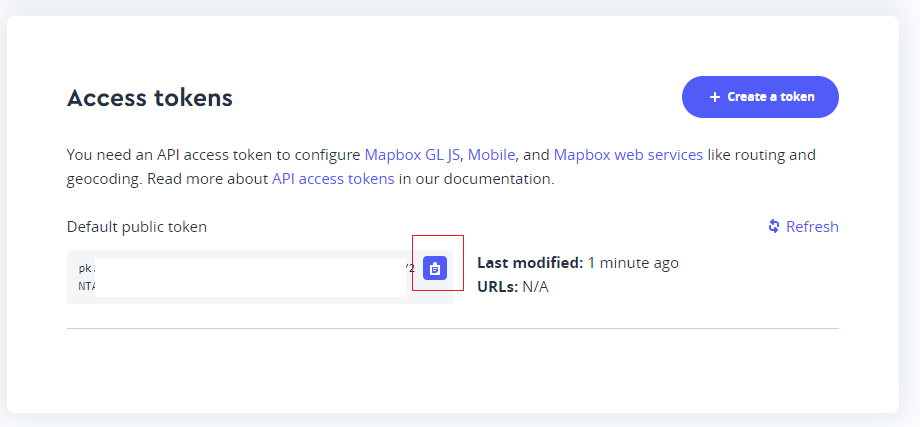
Once you login you can see the public access token on the main login screen. To copy the token to your clip board, Click on the Clipboard in the Default public token window toward the bottom of the screen.
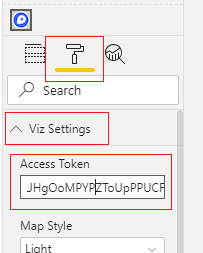
Take the copied token and place it in the mapbox visual inside the Properties pane, under the Viz Settings for the field labeled Access Token.
Now, add fields from your data model into the map visual to create a map.
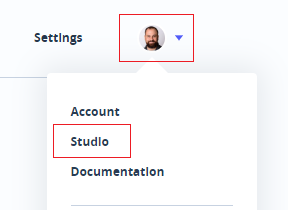
Return to your account within mapbox.com. Click on your account icon, then Click on the Studio option in the drop down menu.
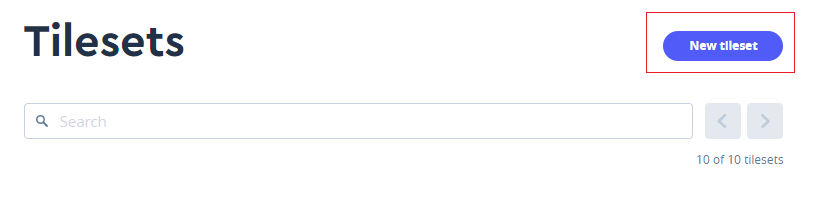
Click on the option on the main header bar labeled Tilesets.
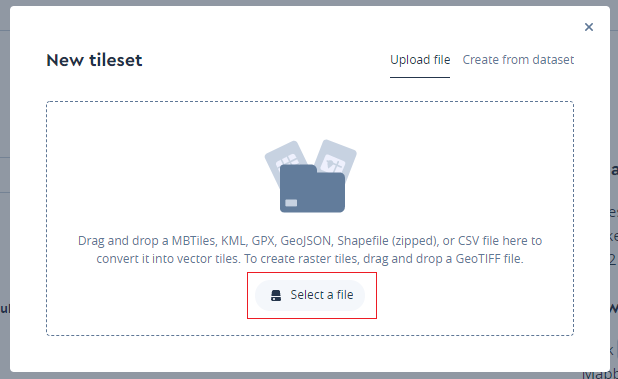
Click on the button labeled New Tileset.
Next, upload your shape file into mapbox by clicking Select a file.
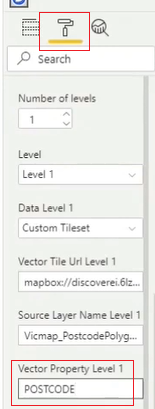
You will need three pieces of data to add the Chloropleth map.
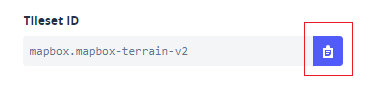
You need the Vector Tile Url Level 1 or the Tileset ID from mapbox.com. Obtain this by clicking on one of the tilesets in mapbox.com and copying the Tileset ID by clicking on the clipboard icon in the Tileset ID window. Paste this value into the field labeled Vector Tile Url Level 1. Note: The final URL needs to contain the mapbox:// beginning URL. Thus, your final URL should look similar to the following mapbox://mapbox.mapbox-terrain-v2
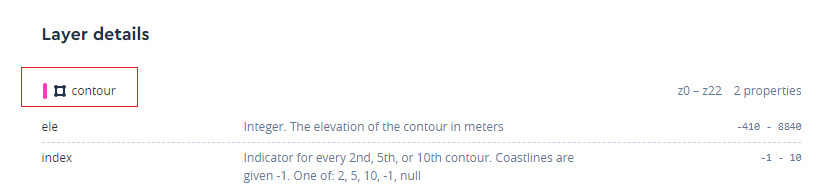
You will need the layer you will be visualizing. This is found under the Tileset Layer Details. Copy the name of the Layer you will use in your mapbox visual. Paste this property into the Source Layer Name Level 1 input box.
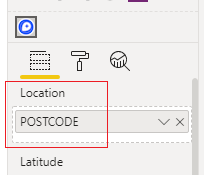
Finally, add the data layer of the Tileset into the Vector Property Level 1. This must be a column of data that resides inside your Power BI data model. In the video example our column name was POSTCODE. This column was also added to the Location field settings of the mapbox visual.
With these settings in place we can now see a Cloropleth map of our data. Continue styling the visual to suit your needs.
If you’re keen to learn how to create really cool customized maps for your Power BI reports, then make sure to check out the other video blogs in this 4-part MapBox series. Additional videos will cover how to create 3-D maps, multi-layer drill downs, and design your own styles!
And
if you want to learn how you can create really beautiful and engaging Power BI
reports, get in touch with one of the DiscoverEI team to register for our brand-new
online training courses:
If you like the content from PowerBI.Tips please follow us on all the social outlets. Stay up to date on all the latest features and free tutorials. Subscribe to our YouTube Channel. Or follow us on the social channels, Twitter and LinkedIn where we will post all the announcements for new tutorials and content.
Introducing our PowerBI.tips SWAG store. Check out all the fun PowerBI.tips clothing and products:
Tabular Editor is an incredible Tool that enables users to manipulate a Tabular model at lighting speeds. Daniel Otykier is the creator of the Tabular Editor program. We are producing a video series to enable users of Power BI and data modelers for Analysis Services to learn more about this program.
Trust me this will be the best 4 hours of learning you will do this year. Learn about Tabular Editor and how it can save you HOURS of time. It will be worth it.
In this Series
This series will be broken down in to four topics.
Introduction
Using Scripting to remove repetitive tasks
Best Practice Analyzer to ensure your model is top notch
Incorporating DevOps with Tabular Models
Introduction
Daniel walks us through the basics of the program. We get a little bit of history on how the tool was developed and why you need to know about it.
Using Scripting
This by far is where the tool shines. Scripting allows users to automate common tasks for, creating measures, adding descriptions, building common calculations, hiding measure and more.
Best Practice Analyzer
Model running slow? This feature of Tabular Editor will allow you to quickly review your entire model and find areas for improvement.
DevOps
Once you have a data model how do you control versions? Or, can multiple people work on the same data model? Yes, to both of these questions. This video discusses manage data models with a DevOps pipeline.
All Videos
What all the videos in the series from Start to finish.
If you like the content from PowerBI.Tips please follow us on all the social outlets. Stay up to date on all the latest features and free tutorials. Subscribe to our YouTube Channel. Or follow us on the social channels, Twitter and LinkedIn where we will post all the announcements for new tutorials and content.
Introducing our PowerBI.tips SWAG store. Check out all the fun PowerBI.tips clothing and products:
The Milwaukee Brew City PUG for February had tons of rich demo content. Steve Campbell delivered quite a session for an hour and a half. We were able to record this session and are happy to announce all the videos are now up on YouTube.
If you like the content from PowerBI.Tips please follow us on all the social outlets. Stay up to date on all the latest features and free tutorials. Subscribe to our YouTube Channel. Or follow us on the social channels, Twitter and LinkedIn where we will post all the announcements for new tutorials and content.
Introducing our PowerBI.tips SWAG store. Check out all the fun PowerBI.tips clothing and products:
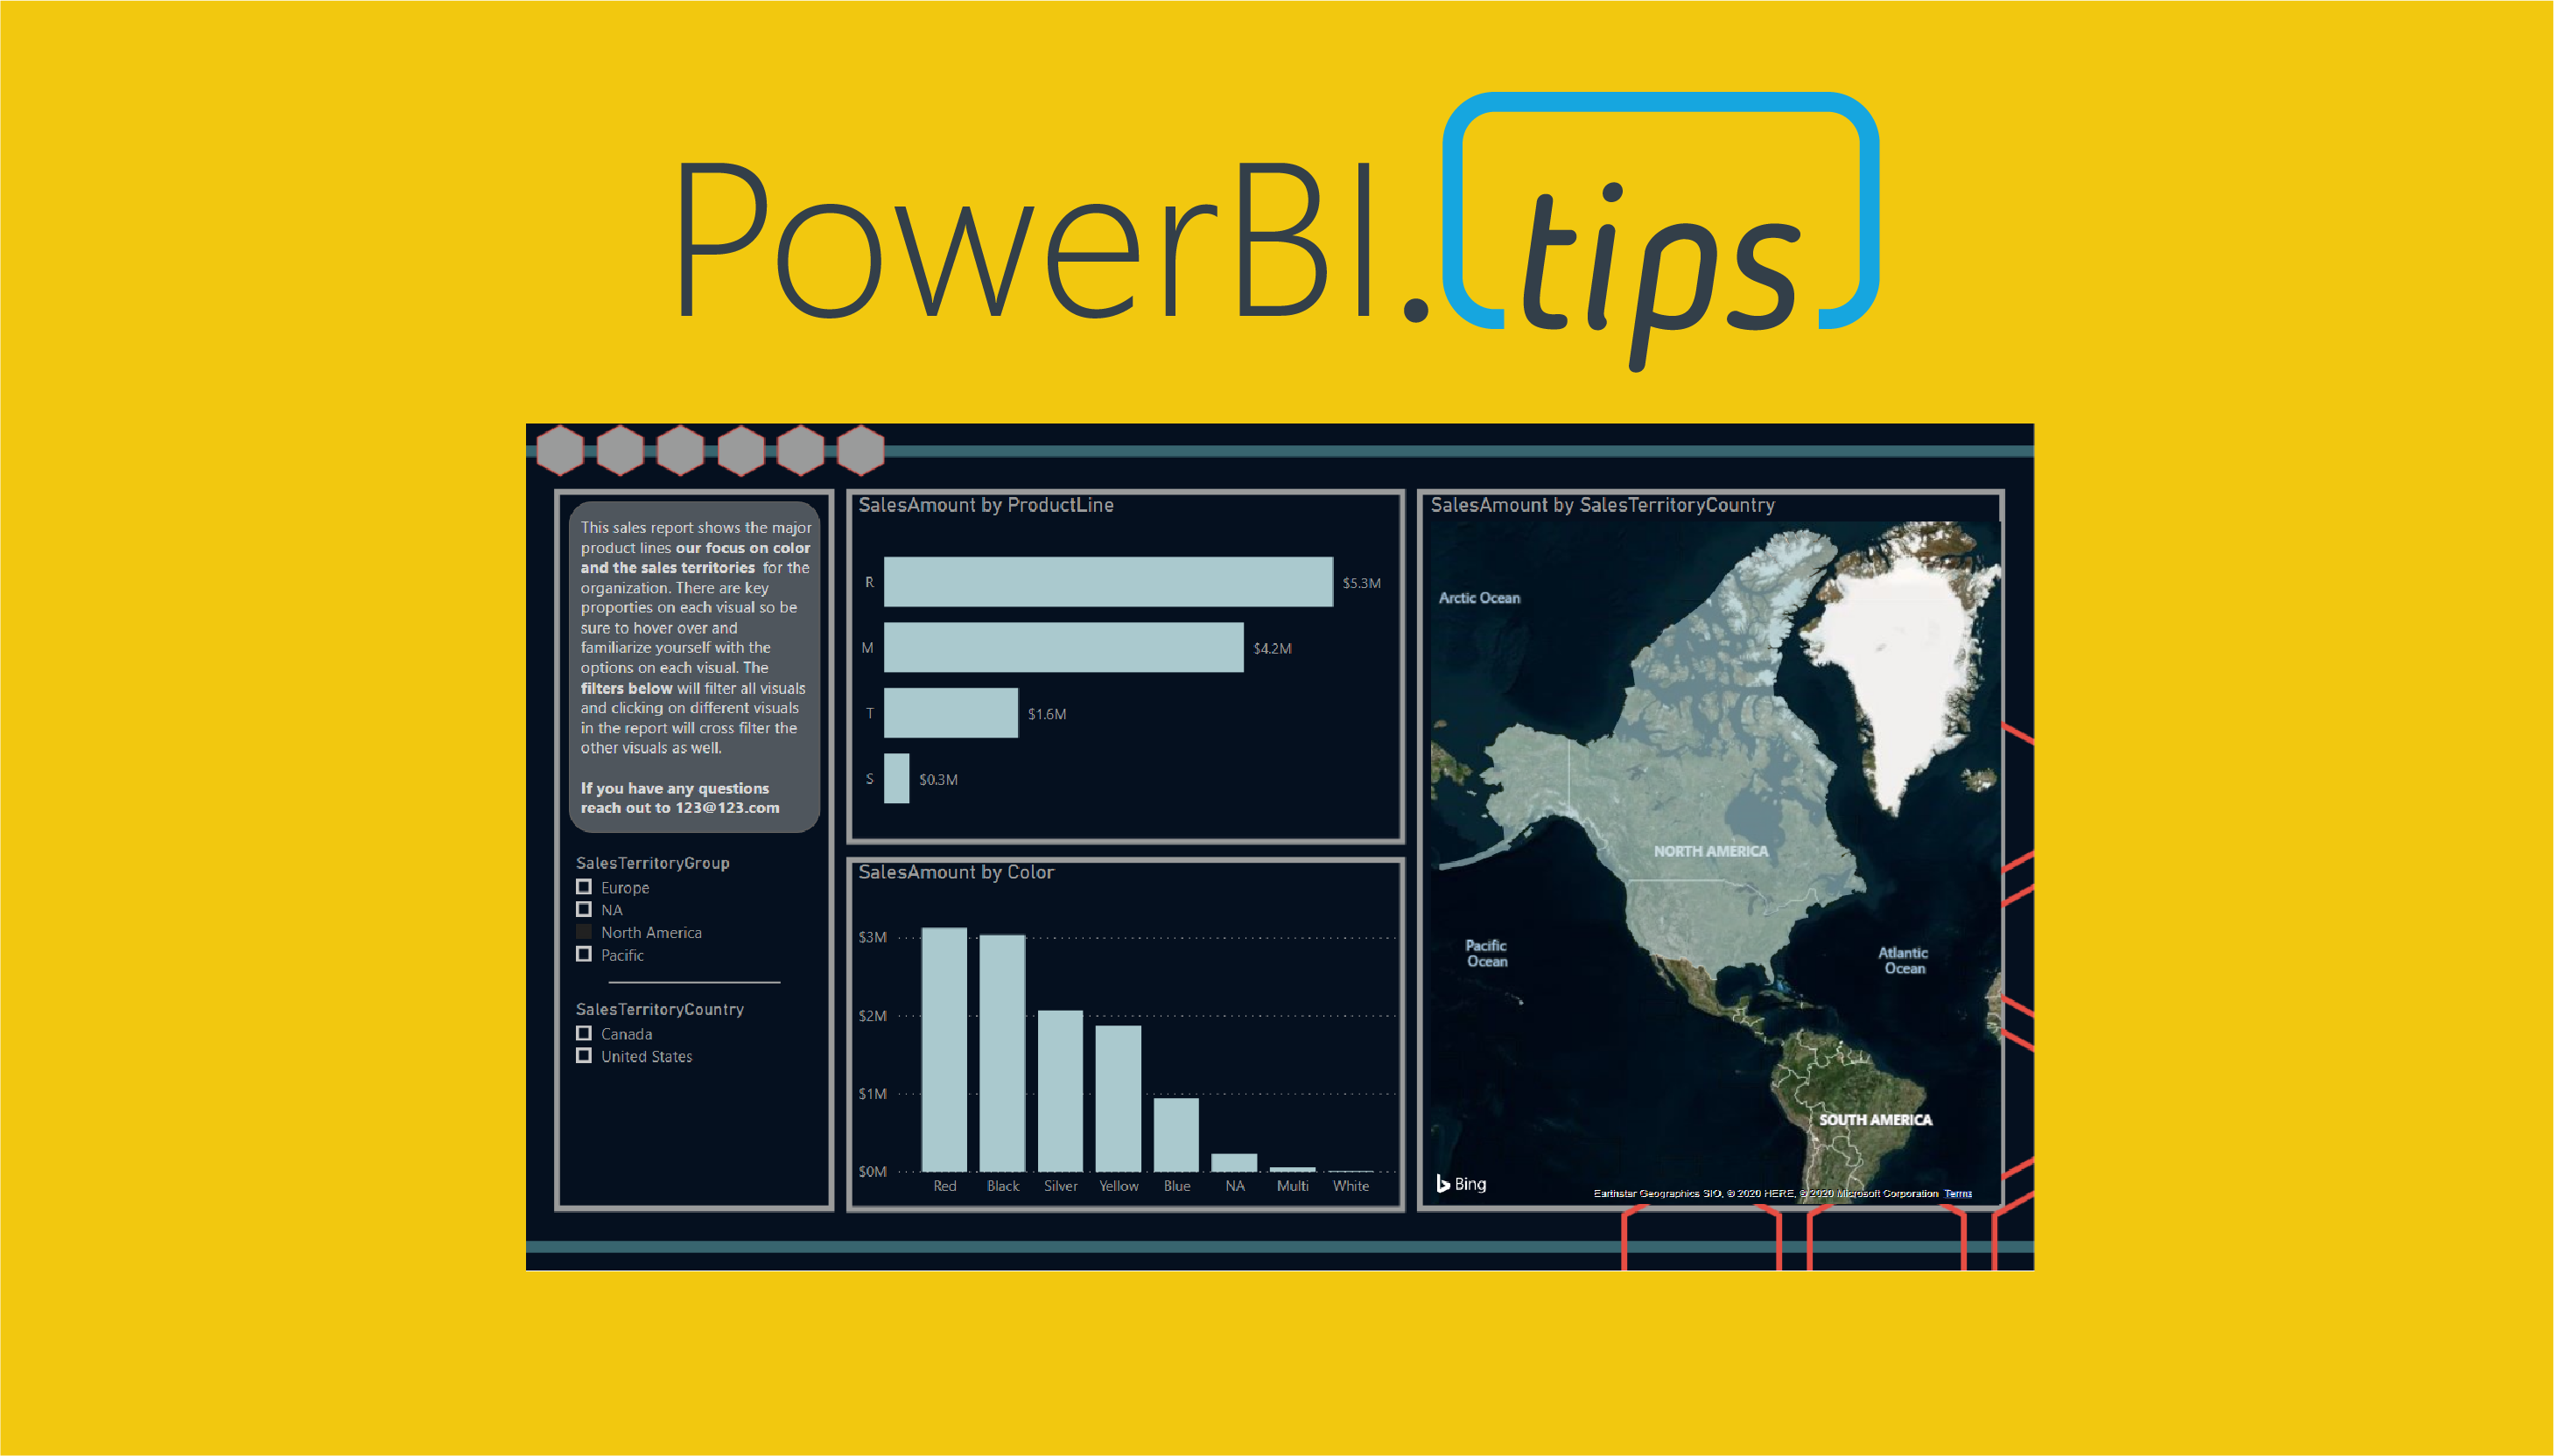
I was recently working on some new ideas for a Scrim when I stumbled upon something interesting. A scrim is pretty specific in its layout, and this one is no different. The images are set so that the report author can easily snap the visual sizes into the space. This makes the most sense as it is easy and delivers great looking results. However, I believe that some designs will allow us to get much more mileage out of a single Scrim. In this Scrim I have changed the shape of visual spaces and this has led to some interesting outcomes. I’ll be interested if my excitement around the possible use cases for this Scrim are as significant as I think they are. With that said here are some of the biggest highlights of my latest Scrim – Versatile.
Gradient background to add depth
Transparent background – allows report author to use any background color
For additional details, and how you can implement all the above in this Scrim check out the video below.
See how to use this Scrim
If you like the content from PowerBI.Tips, please follow us on all the social outlets to stay up to date on all the latest features and free tutorials. Subscribe to our YouTube Channel, and follow us on Twitter where we will post all the announcements for new tutorials and content. Alternatively, you can catch us on LinkedIn (Seth) LinkedIn (Mike) where we will post all the announcements for new tutorials and content.
As always, you’ll find the coolest PowerBI.tips SWAG in our store. Check out all the fun PowerBI.tips clothing and products:
As a report author it is important that you build the necessary context for your end users. The main areas most often needing context either relate to the data or functionality contained within the report. The battle of space, usability and design all impact the choices we have. Lucky for us, Power BI has many different options and we have plenty of choices. This video will walk through the following options and explain methods on how to use them.
Text on Page
Visual Header Tooltip
Button or Imagefor
The Overlay
A Different Page
A Different Report
If you like the content from PowerBI.Tips, please follow us on all the social outlets to stay up to date on all the latest features and free tutorials. Subscribe to our YouTube Channel, and follow us on Twitter where we will post all the announcements for new tutorials and content. Alternatively, you can catch us on LinkedIn (Seth) LinkedIn (Mike) where we will post all the announcements for new tutorials and content.
As always, you’ll find the coolest PowerBI.tips SWAG in our store. Check out all the fun PowerBI.tips clothing and products:
This report is just over the top amazing cool! Check out the work done by the Microsoft team to make this incredible report. It is called the Microsoft Sales & Returns report. We love this one so much we have produced over 48 HIGH RESOLUTION scrims based on this report design. Download all of them for free.
If you like the content from PowerBI.Tips please follow us on all the social outlets. Stay up to date on all the latest features and free tutorials. Subscribe to our YouTube Channel. Or follow us on the social channels, Twitter and LinkedIn where we will post all the announcements for new tutorials and content.
Introducing our PowerBI.tips SWAG store. Check out all the fun PowerBI.tips clothing and products:
This article is the second part in a series on API calls. It will look at some best practices and considerations when using API calls in Power Query. While it does not serve as a definitive list, it is an important start to consider performance when using such queries.
The articles in the first part of the series can be read here:
Batch queries refer to sending information in “batches”. Making an API call requires information to be sent to an external source, that information returned, then the information parsed and then loaded. Imagine we are doing this for thousands of different dimensions. Consequently, you will have the exact same process to be repeated this many times. Instead, check in the API documentation if batch queries are available. As a result, you may be able to send many of the dimensions in the same API call. This will drastically reduce the amount of times this process happens.
Use Data Factory
Data Factory is an Azure service that offers no/low code solution to Extract, Transform and Load (ETL) or ELT (Extract Load, Transform) processes. These are called “pipelines”. Pipelines are repeatable processes that allow you to copy and move data from one source to another (read the documentation here).
Let’s say you’re trying to load a high level of stock data for thousands of stocks. By doing this in Power Query may put big stress on your gateway. Your gateway may get overloaded and cannot handle sending so many complex API calls. It may be a better idea to load the data into a separate table (such as Azure Synapse). Then your power BI report can read this file directly. Read this documentation for a good overview of this architecture.
Shifting this to the Azure cloud can leverage Data Factory’s auto-scalability and ability to handle large volumes of data. This results in a more reliable and robust process.
Consider the most efficient design
Always consider the way that will send the least number of queries. For example, if you are using historical data that doesn’t change, think if you need to refresh this data every day. In addition, try and avoid sending the same information multiple times. Do queries off unique lists.
Only return the correct data
If you load data into Power Query from a source such as SQL Server and then remove columns, a process called Query Folding will take place. Essentially, the data isn’t even loaded into Power Query – it edits the SQL query to not include these columns.
This can only be done on certain sources. Custom APIs will not do this. Therefore, make sure you send the correct queries. Don’t return extra bits of data that is not needed and make sure you only return columns you will use.
Review
While this is by no way a definitive list, it should serve as a starting point to acknowledge performance considerations. Pay attention to how many queries are sent out and try to limit duplication. Remember, Power Query is a powerful tool, but make sure you are using the right tool for the job. Very large and complex operations can be improved with the help of other tools, such as Data Factory.
Recently I had the privilege of working with Microsoft doing a Webinar on layouts. One thing we are passionate about at PowerBI.Tips is good looking reports that drive action. Often as report authors we spend a ton of time working on the data model, and the calculations. While these things are important, we must also consider the user experience.
You may have the most compelling report but lack some visual appeal. Alternatively we might have a great looking report but the navigation or interactions is un-intuitive. We then are spoiling the impact power of our report.
Use Layouts
This is where we feel our layouts make a great fit. It provides a shortcut to provide excellent looking reports on top of your existing data model.
Get your hands on some layouts now and try them out. Check out the downloads below.
Want a Layout without the PowerBI.Tips Branding. Check out these paid layouts.
If you like the content from PowerBI.Tips please follow us on all the social outlets. Stay up to date on all the latest features and free tutorials. Subscribe to our YouTube Channel. Or follow us on the social channels, Twitter and LinkedIn where we will post all the announcements for new tutorials and content.
Introducing our PowerBI.tips SWAG store. Check out all the fun PowerBI.tips clothing and products:
This month we did a webinar with the Microsoft team on how to build different custom visuals in Charts.PowerBI.Tips a version of Charticulator.
If you haven’t seen Charts.PowerBI.Tips this video explains the program, all the functions of each button and building demos. We walk through all the buttons on the tool bar and what they do. Finally we build multiple different charts. Check out this webinar if your curious about building custom visuals with no code.
I want to give a super big thank you to the Microsoft team especially Kelly Kaye for making this video happen.
Thanks for watching and have a Wonderful Day!
If you like the content from PowerBI.Tips please follow us on all the social outlets. Stay up to date on all the latest features and free tutorials. Subscribe to our YouTube Channel. Or follow us on the social channels, Twitter and LinkedIn where we will post all the announcements for new tutorials and content.
Introducing our PowerBI.tips SWAG store. Check out all the fun PowerBI.tips clothing and products:
Check out the new Merch!
Hasta La Vista Data
Go Ahead Make My Data
PBIX Hat
Manage Consent
To provide the best experiences, we use technologies like cookies to store and/or access device information. Consenting to these technologies will allow us to process data such as browsing behavior or unique IDs on this site. Not consenting or withdrawing consent, may adversely affect certain features and functions.
Functional
Always active
The technical storage or access is strictly necessary for the legitimate purpose of enabling the use of a specific service explicitly requested by the subscriber or user, or for the sole purpose of carrying out the transmission of a communication over an electronic communications network.
Preferences
The technical storage or access is necessary for the legitimate purpose of storing preferences that are not requested by the subscriber or user.
Statistics
The technical storage or access that is used exclusively for statistical purposes.The technical storage or access that is used exclusively for anonymous statistical purposes. Without a subpoena, voluntary compliance on the part of your Internet Service Provider, or additional records from a third party, information stored or retrieved for this purpose alone cannot usually be used to identify you.
Marketing
The technical storage or access is required to create user profiles to send advertising, or to track the user on a website or across several websites for similar marketing purposes.