This article examines using the advanced editor in Power Query to better handle when things go wrong. It will also allow custom actions to be triggered using Power Automate, allowing the rest of the data to be refreshed while alerting the owner by email of data source errors.
Note that this article requires edit Power Query (M) code. If you want to review this, consider reading this article:
Query Editor – Editing M Code
Data Sources
Data can be messy. Thankfully, Power Query has given us an excellent and efficient way to extract, transform and load the data to manipulate it to the way we want it. It is extremely versatile and can connect to a huge host of data sources. These can include third party sources as well as internal data.
While beneficial, we need to ask what happens if the third-party source suddenly shuts down or changes its access policies. What if there is bad data recorded in the on-premise excel sheet or databases? An error in any Power Query step can stop the entire report refreshing. We can opt to receive alerts on the service, but these can be unspecific and require us to dig deep into the report.
The technique laid out here allows to receive a specific alert of the exact step the error occurred. What’s more, we can ensure it won’t break our queries and continue to refresh the rest of the data.
Step 1 – Base Query
First we need to set up the query that we want to error handle. For this example, I’m going to send a web request to get some information about the Microsoft stock price. For more information on this API or to pull other stock data, check out this article.
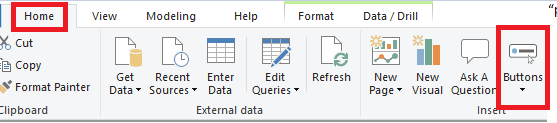
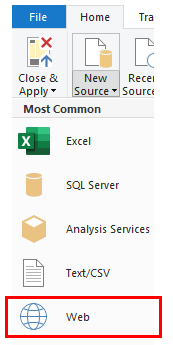
Open Power Query and Select the New Source > Web on the Home ribbon.
Paste the following link:
https://query1.finance.yahoo.com/v8/finance/chart/MSFT?range=5y&interval=1d
This will automatically return a JSON object and parse it for us.
Note: This link returns 5 years of daily daily historical stock price.
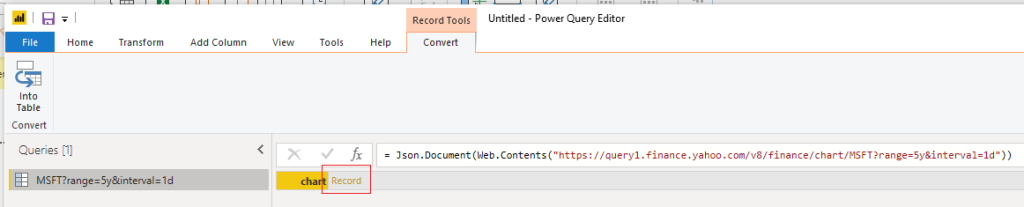
For simplicity, I will just return the meta data to ensure the API call is working. The automatic parsing will return a table with clickable elements. To explore into the JSON we, click through the following steps:
chart:Record > result:list > Record > Meta:Record
Note: See sample of nested structure below for chart:Record
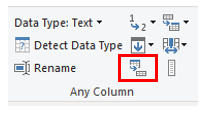
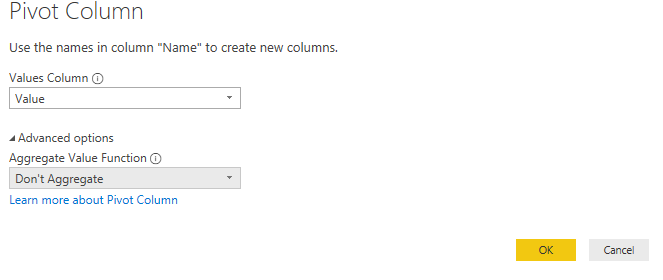
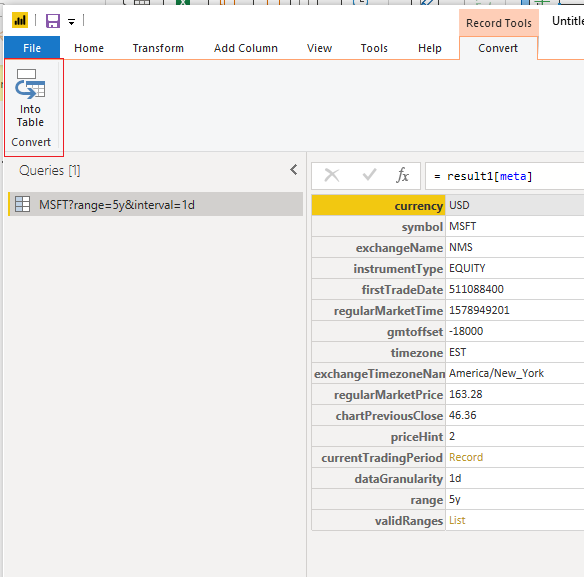
Once we have expanded all the way down to the Meta level, Press the Convert Into Table Button found on the newly appeared Convert ribbon.
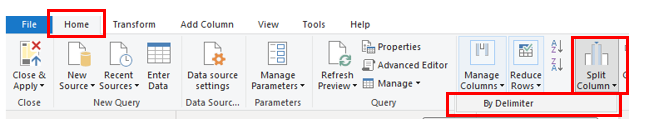
Here is the final code, which you can see by Clicking the Advanced Editor button on the Home ribbon revealing the advanced editor:
let
    Source = Json.Document(Web.Contents("https://query1.finance.yahoo.com/v8/finance/chart/MSFT?range=5y&interval=1d")),
    chart = Source[chart],
    result = chart[result],
    result1 = result{0},
    #"meta" = result1[meta],
    #"Converted to Table" = Record.ToTable(#"meta")
in
    #"Converted to Table
Rename this “Stock Query” by editing the name in the properties pane on the right.
Step 2 – Create the flow
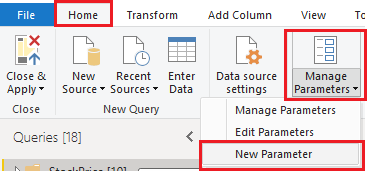
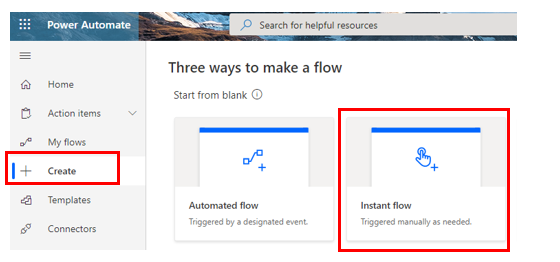
Next we create the Power Automate flow that will alert us something is wrong. Navigate to the Power Automate website. Once logged in, Click on the new Instant flow button.
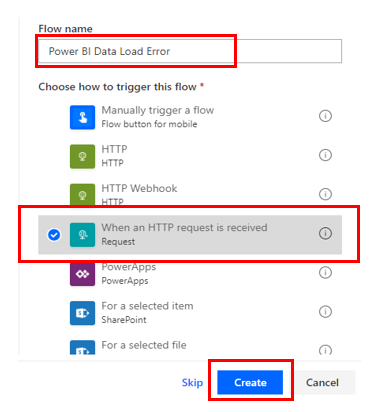
Give the flow an appropriate name. For the trigger, select the option When an HTTP request is received. Next press the button Create to make the flow.
Once we save the flow will supply us with a URL. This URL will trigger the flow any time it is visited. You can use any action you want, but I will have the flow send me an email to let me know the refresh failed.
I’ll search for the item Send an email (V2). Make sure you fill in the email address you want to send it to, and write an appropriate message and subject.
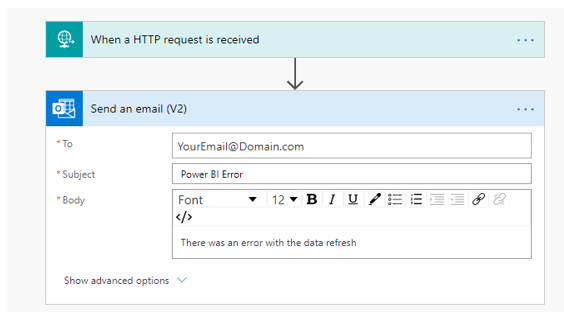
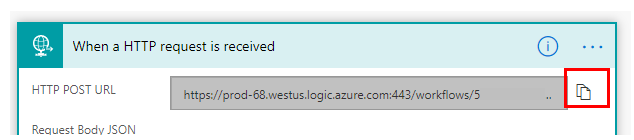
That’s our flow! Hit Save. After you have saved, click on the When a HTTP request is received step to expand it. You’ll see that a URL has been generated. Copy the link using the Copy button on the right. You’ll need this to enter it into Power BI.
Step 3 – Make the Flow Trigger Query
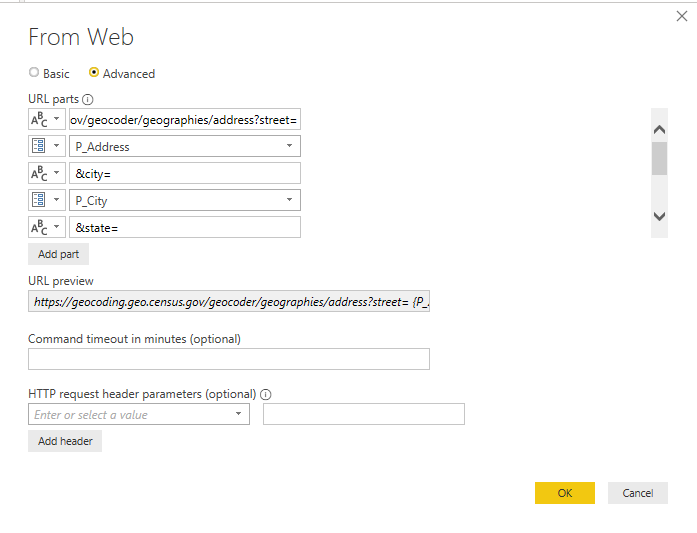
Next, set up the query in Power BI to call this flow. In Power Query, make a new query by selecting New Source > Web. Paste in the Web URL you copied in the previous step. Open the advanced editor. Inside you see the code uses the Web.Contents() function. You’ll need to copy this code in a later step.
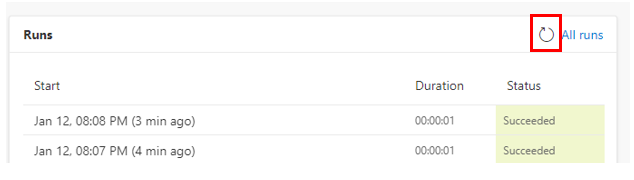
This will send an email as it runs the query. For testing, if you press the Refresh Preview icon, you can trigger the actions to run again. If you don’t want to wait for the email or chose a different action, you can check if the flow ran by checking it on the power automate site. Click My Flows on the left, open the flow and scroll down to Runs.
Press the refresh button on the runs section to check when the flow ran.
Step 4 – Set up the Error Handling Code
Now we need to add the logic to have the Power Automate run on error, which is going to take a little coding.
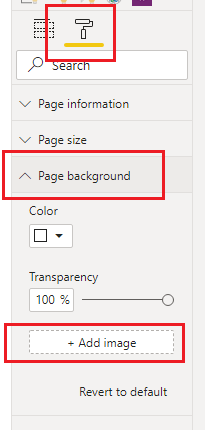
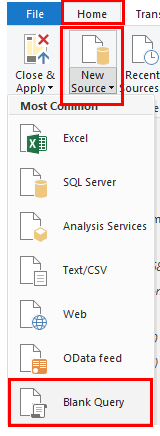
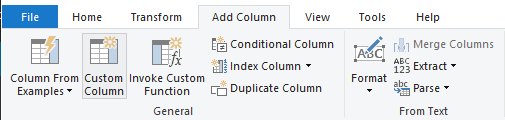
Back in Power Query, start by adding a blank query by clicking New Source > Blank Query on the Home Ribbon.
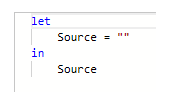
Next, open the Advanced Editor and the code should look like this:
Now we will employ the try … otherwise statement. This is Power Query’s error handing statement. We can add a placeholder for now.
Replace the step:
Source = ""
with the following code:
Source = try 1+1 otherwise “error”How this works
Any code between the try and otherwise keywords will be attempted to be executed. If this is successful, the result will be returned and the next step will be evaluated, in this case the number 2. If this returns an error, however, the result will be discarded and the query after the word otherwise will be returned, in this case the word “error” .
We can add this statement as the Source step. I’ll also wrap both statements in parenthesis as this will come in handy as we add more steps. It’s important to keep good syntax to make it readable, so here is my code:
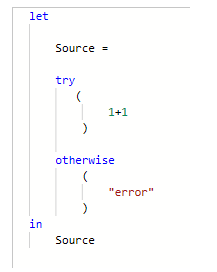
As 1+1 is valid, this will return the value 2. If you change the 1+1 to 1+“A”, this is not valid so it will return the word error.
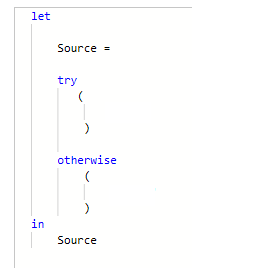
Now we can see its working, delete everything between the parenthesis in both the try and otherwise statement to set up for the next step. Do not worry if you get an error as we will be adding code to it.
Step 5 – Update the Error Handling Code
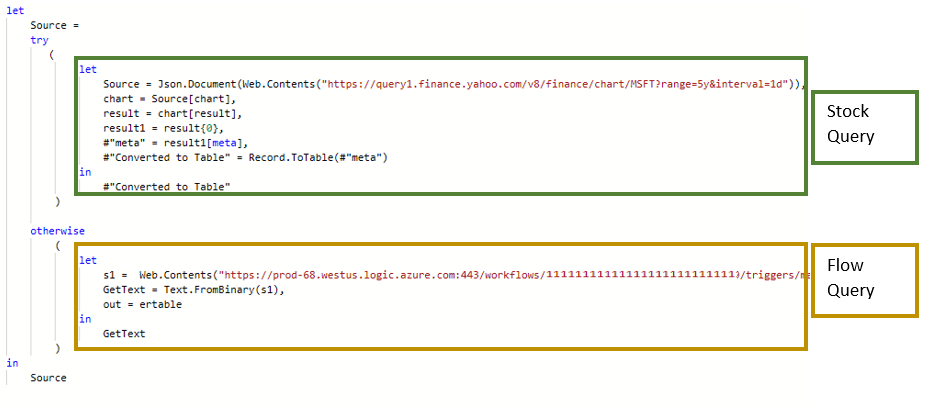
Now we’ve got the placeholder set up we can copy our previous code into each step.
Open the Stock Query we made in steps 1 and 2.
Click Advanced Editor and copy the entire code.
Now, come back to the try..otherwise query.
Open the advanced editor in this step and make sure you delete anything between the parenthesis in the try statement if you did not before.
Paste the entire code you just copied.
Next, go to the Flow Error Query, open the advanced editor and copy all the text.
Go back to the try..otherwise and paste everything between the two parenthesis for the otherwise statement.
Step 6 – Tidying the Code Up
The URLs are prone to change so it is code practice to separate them as a variable. To do this, you can simply state them at the beginning of the query as a step.
Here, add the URLs to variables called WebURL and FlowURL.
To add WebURL, at the beginning of query after the let keyword, add the line:
webURL = "https://query1.finance.yahoo.com/v8/finance/chart/MSFT?range=5y&interval=1d",Don’t forget the comma at the end. Do the same with the FlowURL. Then, replace the URLs with the variable name.
Additionally, it will help to change the word Source outside the try..otherwise to Output. This makes it easier to follow, as we have several steps called source. Also update it after the keyword in.
Output:
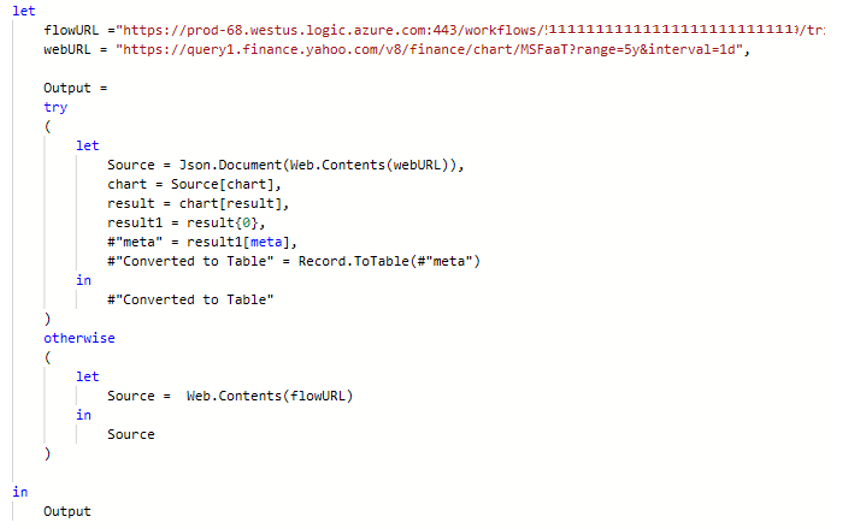
Final code to copy (you will need to update to your correct URLS):
let
    flowURL ="https://prod-68.westus.logic.azure.com:443/workflows/ RestofURL",
    webURL = "https://query1.finance.yahoo.com/v8/finance/chart/MSFaaT?range=5y&interval=1d",

    Output =
    try
    (
        let
            Source = Json.Document(Web.Contents(webURL)),
            chart = Source[chart],
            result = chart[result],
            result1 = result{0},
            #"meta" = result1[meta],
            #"Converted to Table" = Record.ToTable(#"meta")
        in
            #"Converted to Table"
    )
    otherwise
    (
        let
            Source =  Web.Contents(flowURL)
        in
            Source
    )

in
    Output
Optional Step 7.1 – Adding POST Parameter – Flow
Now we have set up our workflow, it may be useful to reuse this on multiple datasets. Instead of setting up a different flow for each dataset, we can allow the flow to accept inputs, such as the dataset name.
Navigate back to Power Automate site and on the flow set up previously, click edit.
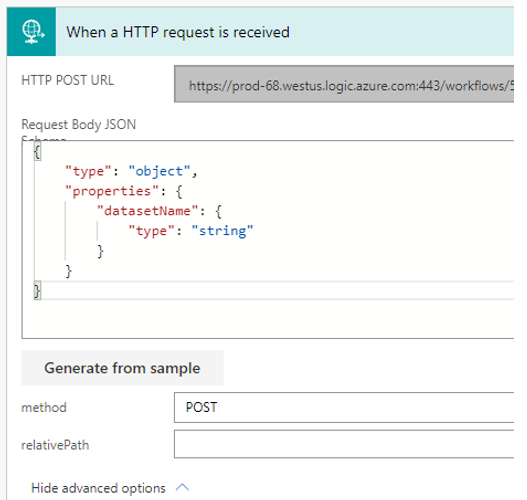
Open the step and paste in the following code into Request body JSON.
{
    "type": "object",
    "properties": {
        "datasetName": {
            "type": "string"
        }
    }
}
Next, expand advanced options and change it to POST.
This will create a variable called datasetName. This is the name of the dataset we will pass from Power BI. We can use datasetName in the email to inform us which dataset had an error. The variable will appear in a list when you click to edit the email message – click on the name to add it.
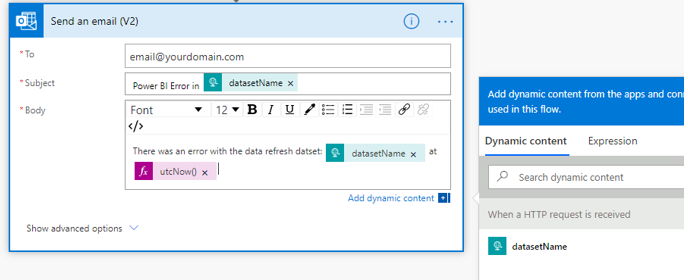
In addition, I added the expression utcNow(). You can find this by searching in the Expression tab of the pop up. This just displays the time it is sent. Thus we can see in the email when it failed. Notice the variable from the first step is green, while the expression is pink.
Personalize this message as you wish.
Optional Step 7.2 – Adding POST Parameter – Power BI
The final step is to pass this in from Power BI. In our query, open the advanced editor and add three more parameters before webURL and flowURL:
    datasetName = "Stock Query",
    content = " { ""datasetName"": """ & datasetName & """}",
    headers = [ #"Content-Type"="application/json"],
dataset name is the name of the datset we pass into the flow and ultimately appear in the email. Right now it’s set to Stock Query, but this is what we can edit for each dataset we use this query to pass a different name.
content and headers build the correct format to pass into the API call. This will create a POST request and provide the correct format.
Now we can edit the Web.Contents(webURL) step to include our parameters:
Source = Web.Contents(flowURL, [Headers = headers, Content=Text.ToBinary(content)]) Final output:
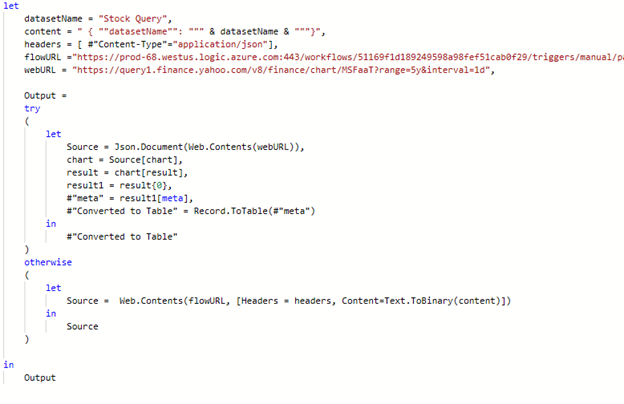
Final code to copy (you will need to update to your correct URLS):
let
    datasetName = "Stock Query",
    content = " { ""datasetName"": """ & datasetName & """}",
    headers = [ #"Content-Type"="application/json"],
    flowURL ="https://prod-68.westus.logic.azure.com:443/workflows/RestofURL",
    webURL = "https://query1.finance.yahoo.com/v8/finance/chart/MSFaaT?range=5y&interval=1d",

    Output =
    try
    (
        let
            Source = Json.Document(Web.Contents(webURL)),
            chart = Source[chart],
            result = chart[result],
            result1 = result{0},
            #"meta" = result1[meta],
            #"Converted to Table" = Record.ToTable(#"meta")
        in
            #"Converted to Table"
    )
    otherwise
    (
        let
            Source =  Web.Contents(flowURL, [Headers = headers, Content=Text.ToBinary(content)])
        in
            Source
    )

in
    Output
Limitations and Considerations
This technique uses premium Power Automate features and a valid license is required. However, only one service account license is needed.
This query has been designed to return blank data if the query fails. This could break your model if this data is required.
This blog does not examine securing the Power Automate endpoint, so be aware if the URL was discovered people could execute the end action (in this case sending an email).
If you like the content from PowerBI.Tips please follow us on all the social outlets to stay up to date on all the latest features and free tutorials. Subscribe to our YouTube Channel. Or follow us on the social channels, Twitter and LinkedIn where we will post all the announcements for new tutorials and content.
Introducing our PowerBI.tips SWAG store. Check out all the fun PowerBI.tips clothing and products: